Fibonacci retracement is one of the most popular tools in technical analysis, used by traders to predict potential levels of support and resistance in a trending market. Whether you’re trading forex, stocks, or commodities, Fibonacci retracement can help identify key price levels to enter and exit positions.
In this guide, we’ll explore what Fibonacci retracement is, how it works, and how to apply it to your trading strategy for smarter decision-making.
- What Is Fibonacci Retracement?
Fibonacci retracement is a technical analysis tool based on the Fibonacci sequence — a series of numbers where each number is the sum of the two preceding ones (e.g., 0, 1, 1, 2, 3, 5, 8, 13, 21, 34, 55, and so on).
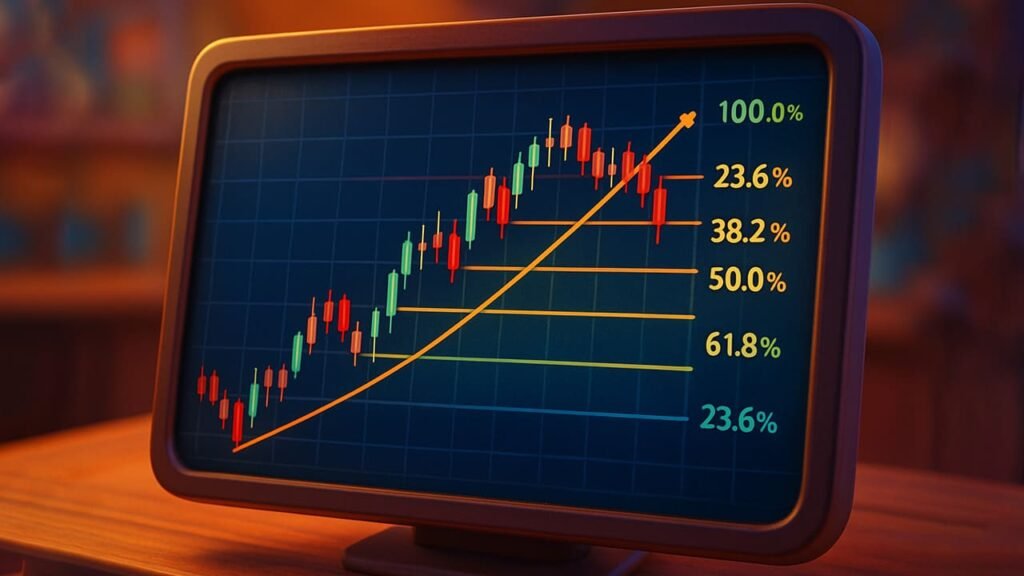
In trading, Fibonacci retracement levels are horizontal lines that indicate where price may experience support or resistance during a pullback in a trend. These levels are derived from key Fibonacci ratios:
- 23.6%
- 38.2%
- 50.0%
- 61.8%
- 100.0%
These ratios are used to predict potential price levels where a trend might reverse, providing traders with areas to place buy or sell orders.
- How Fibonacci Retracement Works
To apply Fibonacci retracement, traders typically follow these steps:
- Identify a Trend:
First, identify a strong trend (either uptrend or downtrend). - Select the Fibonacci Tool:
On your trading platform, select the Fibonacci retracement tool (usually found in the “drawing tools” section). - Plot the Fibonacci Levels:
- For an uptrend, you plot the Fibonacci retracement from the low point to the high point of the trend.
- For a downtrend, you plot from the high point to the low point.
- Observe the Retracement Levels:
Once you apply the tool, the retracement levels will automatically appear on your chart. These levels represent potential areas where the price might reverse or consolidate.
- The Key Fibonacci Retracement Levels
Each Fibonacci level represents a possible area of price reversal or support. The most important Fibonacci levels are 38.2%, 50.0%, and 61.8%, as these are where price tends to make the strongest corrections.
- 23.6% Retracement
This is a minor retracement level and often leads to small pullbacks in price. It’s more commonly seen in strong trends. A price retracing to the 23.6% level can indicate a continuation of the current trend.
- 38.2% Retracement
This level tends to attract more significant corrections. Traders often consider it a key level to watch for a trend continuation or reversal. A break below this level (in an uptrend) can signal a more substantial correction.
- 50.0% Retracement
While not technically part of the Fibonacci sequence, the 50.0% retracement level is widely used by traders. A price retracement to 50.0% is often viewed as a major area of support or resistance.
- 61.8% Retracement
The 61.8% retracement level is considered the most critical. Often referred to as the “Golden Ratio,” it’s the level that traders watch for the most potential reversals. A price pulling back to 61.8% of its previous move can indicate a stronger reversal or trend continuation.
- 100% Retracement
A 100% retracement occurs when the price returns to its original level before the trend began. This can signal that the trend has been fully reversed.
- Using Fibonacci Retracement with Other Indicators
To increase the effectiveness of Fibonacci retracement, it’s best to combine it with other technical indicators. Here are a few strategies:
- RSI (Relative Strength Index)
Combine Fibonacci retracement with the RSI to confirm overbought or oversold conditions. If the price reaches a Fibonacci level and the RSI is overbought (above 70), it could signal that a reversal is likely.
- MACD (Moving Average Convergence Divergence)
The MACD is great for identifying potential trend reversals. If the MACD shows bullish or bearish divergence at a Fibonacci retracement level, it can confirm a potential reversal.
- Support and Resistance Levels
Fibonacci retracement levels often align with previous support and resistance zones. If a retracement level coincides with an old support/resistance level, it increases the likelihood of a price reversal at that point.
- How to Trade Using Fibonacci Retracement
- Trading in an Uptrend:
- Step 1: Identify the low and high points of the uptrend.
- Step 2: Apply the Fibonacci retracement tool.
- Step 3: Look for the price to retrace to one of the major Fibonacci levels (38.2%, 50%, 61.8%).
- Step 4: Watch for candlestick patterns like bullish engulfing or hammer near the retracement levels for confirmation to buy.
- Trading in a Downtrend:
- Step 1: Identify the high and low points of the downtrend.
- Step 2: Apply the Fibonacci retracement tool.
- Step 3: Wait for the price to retrace to a Fibonacci level (such as 38.2%, 50%, or 61.8%).
- Step 4: Watch for bearish signals like a shooting star or bearish engulfing candle near the retracement levels to confirm a sell.
- Common Mistakes When Using Fibonacci Retracement
While Fibonacci retracement is a powerful tool, many traders make common mistakes. Here’s how to avoid them:
- Ignoring Market Conditions
Fibonacci retracement levels work best when used in conjunction with the prevailing market conditions. Don’t rely solely on Fibonacci levels — always consider the overall trend and market sentiment.
- Using Fibonacci Alone
Fibonacci is most effective when combined with other indicators and tools. It’s a mistake to rely on retracement levels without confirming them with price action or other technical indicators.
- Trading Too Early
Sometimes, price action will temporarily breach a Fibonacci level before reversing. Be patient and wait for confirmation (such as candlestick patterns) before entering trades.
- The Bottom Line
Fibonacci retracement is one of the most useful tools in technical analysis for forex and commodity trading. It provides traders with clear price levels where potential reversals or consolidations may occur.
By combining Fibonacci with other technical tools, such as RSI, MACD, and trendlines, traders can increase the accuracy of their predictions and develop stronger entry and exit strategies.
With patience, discipline, and the right combination of analysis, Fibonacci retracement can be a key part of a successful trading plan.
Ready to master Fibonacci retracement and elevate your trading? Join the Für-Trade newsletter for weekly strategies, expert insights, and market updates on forex and commodity trading.