Most traders naturally gravitate toward either technical analysis or fundamental analysis, but the truth is that the most effective trading decisions often come from combining both.
Fundamentals explain why the market moves — economics, interest rates, news events.
Technical analysis shows when to enter or exit — price action, trends, patterns, and indicators.
When you put the two together, you gain a more complete perspective, allowing you to trade with greater confidence, precision, and consistency.
In this guide, we’ll show you how to blend both approaches into a powerful, smarter trading framework.
- What Is Fundamental Analysis?
Fundamental analysis focuses on understanding the underlying economic, political, and financial forces that drive market prices.
It helps answer questions like:
- Why is EUR/USD rising?
- Why did gold drop after the central bank decision?
- Why are commodity currencies gaining strength?
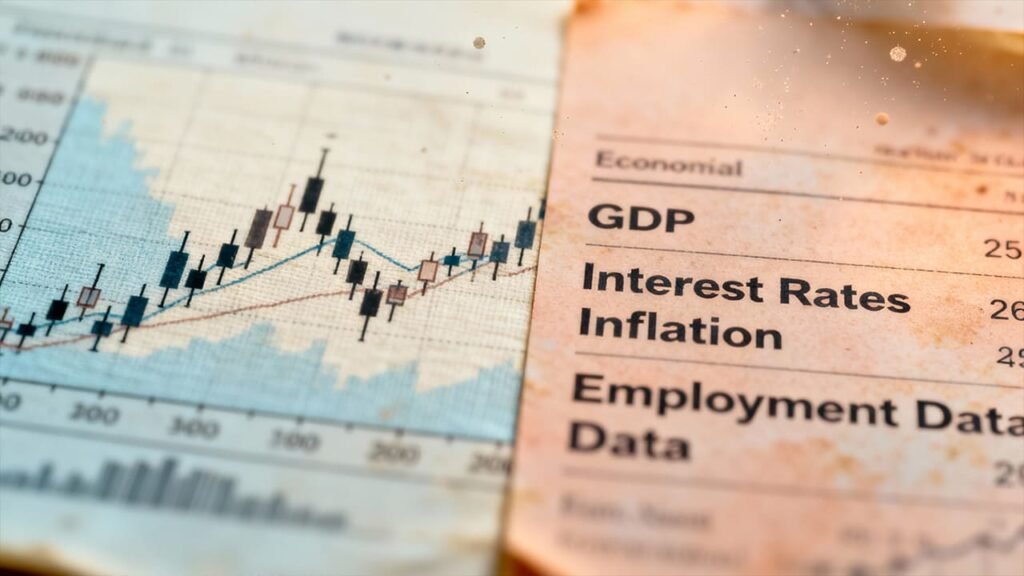
Common Fundamental Factors:
- Interest rate decisions
- Inflation data (CPI)
- Employment figures (like Non-Farm Payrolls)
- GDP growth
- Central bank speeches
- Geopolitical news
- Commodity prices (especially for AUD, CAD, NZD)
Fundamentals create the “big picture” and shape longer-term trends.
- What Is Technical Analysis?
Technical analysis focuses on price charts and market behavior.
It answers questions such as:
- Where should I enter the trade?
- What’s a good stop-loss level?
- Is this pair trending or ranging?
Common Technical Tools:
- Support and resistance
- Trendlines
- Candlestick patterns
- Indicators like RSI, MACD, moving averages
- Breakouts and chart formations (triangles, flags, head-and-shoulders)
Technical analysis helps time your decisions and manage risk.
- Why Combine the Two?
Trading using only fundamentals or only technicals limits your view.
Combining them gives you:
- Higher-probability setups
- Better timing
- More confidence
- Reduced emotional trading
- Stronger risk management
Fundamentals show the direction.
Technicals show the execution.
When they align, you get some of the most powerful and reliable trading opportunities.
- How to Combine Fundamental and Technical Analysis (Step-by-Step)
Here is a simple, practical process suitable for traders at all levels:
Step 1: Start With the Fundamentals (Big Picture)
Ask yourself:
- Is a currency likely to strengthen or weaken based on current data?
- Is a central bank hawkish or dovish right now?
- Are we in a risk-on or risk-off environment?
Example:
If the Federal Reserve signals rate cuts, the USD may weaken.
If the Bank of England hints at rate hikes, GBP may strengthen.
This gives you the directional bias.
Step 2: Move to the Technicals (Precision Timing)
Once you know your bias, look at the charts:
- Identify support/resistance zones.
- Look for trend directions.
- Check indicators for confirmation.
Example:
If fundamentals suggest “GBP strength,” look for technical buying opportunities such as:
- Price bouncing from support
- Bullish candlestick pattern
- Break above a moving average
- RSI recovering from oversold
Step 3: Align Direction + Timing
You want fundamental direction and technical signals to agree.
Example Setup:
- Fundamentals → USD expected to weaken due to rate cuts
- Technicals → EUR/USD breaks above resistance
Action: A long trade (buy EUR/USD) now makes sense.
If fundamentals and technicals are opposite, skip the trade.
Step 4: Plan Your Entry, Stop-Loss, and Take-Profit
Use technical analysis to determine:
- Entry point
- Stop-loss placement (below support or above resistance)
- Take-profit levels (using Fibonacci, previous highs, etc.)
This helps keep your trading disciplined and structured.
Step 5: Monitor News and Data as the Trade Develops
Markets react quickly to:
- Economic releases
- Central bank comments
- Unexpected geopolitical events
A trade that looks great technically may fail if a major announcement contradicts your fundamental view.
Use an economic calendar daily.
- Example of Combining Both Approaches
Let’s walk through a practical EUR/USD example:
Fundamentals:
- Europe’s inflation is rising
- ECB hints at more rate hikes
- U.S. data weakening → Fed may pause or cut
→ Bullish EUR/USD bias
Technicals:
- Price breaks above a major resistance
- Moving averages show bullish crossover
- RSI supports upward momentum
Combined Result:
→ High-probability buy setup
Enter at breakout, stop below support, take profit at the next resistance.
- Mistakes to Avoid When Combining Both
- ❌ Ignoring news and trading purely on charts
- ❌ Overreacting to news but ignoring trend direction
- ❌ Forcing technical trades when fundamentals disagree
- ❌ Overloading charts with indicators
- ❌ Trading immediately during news spikes (use caution)
Remember: The goal is synergy, not conflict.
- Tips for Using Both Approaches Successfully
- Keep your chart simple
- Always check fundamentals before opening a position
- Let technicals refine your entry
- Trade with a clear bias — bullish, bearish, or neutral
- Maintain a trading journal
- Never trade solely on emotions or news headlines
With practice, combining both approaches becomes natural and dramatically improves decision-making.
The Bottom Line
Combining fundamental analysis with technical analysis gives traders the best of both worlds. You gain market context, better timing, and more consistent results.
Fundamentals guide your long-term direction.
Technicals help you execute with precision.
If you want smarter, more confident trades, learn to integrate both — and let them reinforce each other rather than compete.
Ready to trade with more confidence and clarity?
Join the Für-Trade newsletter for weekly strategy insights, market updates, and step-by-step trading education.