Technical analysis is one of the most widely used tools in trading — whether you focus on forex, stocks, indices, or commodities.
It helps traders understand market behavior by studying price charts, patterns, and indicators, rather than relying solely on news or economic data.
For beginners, learning technical analysis is like learning a new language. But once you understand the basics, it becomes a powerful tool that helps you identify trends, manage risk, find entry points, and make trading decisions with confidence.
This guide breaks down technical analysis into simple, easy-to-understand steps suitable for all traders.
- What Is Technical Analysis?
Technical analysis is the study of historical price movements to predict future market behavior.
Instead of analysing company earnings or economic reports, technical analysts focus on:
- Price action
- Chart patterns
- Support and resistance levels
- Indicators and oscillators
The core idea is simple:
Markets often repeat historical patterns because human behavior repeats itself.
- The Three Core Principles of Technical Analysis
- Price Discounts Everything
Every event — economic data, political changes, market sentiment — is already reflected in the price.
- Prices Move in Trends
Markets rarely move in a straight line. They move in uptrends, downtrends, and sideways ranges.
- History Tends to Repeat Itself
Because traders react in predictable ways, certain chart patterns repeat over time.
- The Main Types of Charts in Technical Analysis
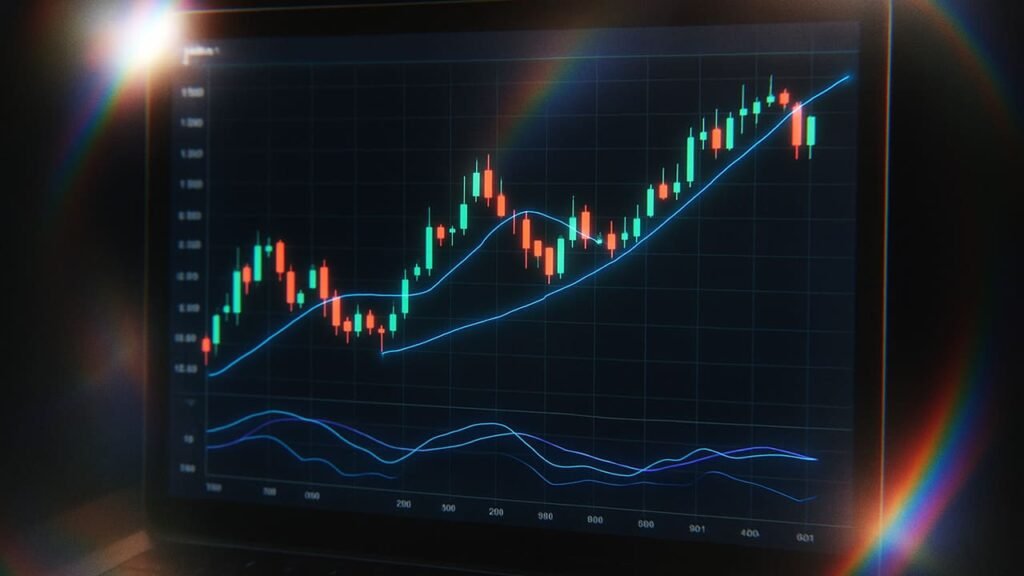
Candlestick Chart (Most Popular)
Shows market psychology and momentum clearly.
Each candle displays:
- Open
- High
- Low
- Close
Bullish candles typically appear green, bearish ones red.
Line Chart
Connects closing prices — great for beginners and spotting general trends.
Bar Chart
Shows more detail (OHLC) but is less visually intuitive than candlesticks.
- Understanding Market Trends
Identifying trends is one of the first skills you must master.
Uptrend
- Higher highs
- Higher lows
- Market dominated by buyers
Downtrend
- Lower highs
- Lower lows
- Market dominated by sellers
Sideways Trend (Range)
Price moves horizontally between support and resistance.
- Key Technical Tools Every Beginner Should Know
- Support and Resistance
- Support: A price level where buying pressure usually prevents further decline.
- Resistance: A level where selling pressure tends to slow upward movement.
These levels help traders decide where to enter or exit trades.
- Trendlines
Simple lines connecting highs or lows to visually confirm the trend direction.
- Moving Averages (MA)
Common tools for identifying trend direction.
Popular types:
- SMA (Simple Moving Average)
- EMA (Exponential Moving Average)
A common technique:
- Price above MA = uptrend
- Price below MA = downtrend
- Relative Strength Index (RSI)
An oscillator that measures overbought or oversold conditions.
- Above 70 = Overbought
- Below 30 = Oversold
- MACD (Moving Average Convergence Divergence)
A momentum indicator that helps identify trend reversals and momentum shifts.
- Popular Technical Patterns
- Chart Patterns
- Head and Shoulders (reversal)
- Double Top / Double Bottom
- Triangles (continuation or breakout)
- Candlestick Patterns
- Doji (indecision)
- Hammer (reversal)
- Engulfing pattern (strong shifts in sentiment)
These patterns help signal potential price direction changes.
- Timeframes in Technical Analysis
Your chart timeframe determines the type of trades you will take:
| Trader Type | Timeframes Used |
| Scalpers | 1–5 minutes |
| Day Traders | 15 min – 1 hour |
| Swing Traders | 4 hours – daily |
| Long-Term Traders | Daily – weekly |
Tip: Beginners often perform best using 1-hour or 4-hour charts — less noise, clearer signals.
- Combining Technical Tools for Better Decisions
No single tool works alone. Successful traders combine indicators, chart patterns, and price action to build a complete picture.
Example approach:
- Identify trend using moving averages
- Mark support/resistance zones
- Use RSI or MACD to confirm entry timing
This multi-step method increases accuracy and reduces false signals.
- Common Mistakes Beginners Make
❌ Using too many indicators
❌ Ignoring the overall trend
❌ Trading without stop-losses
❌ Letting emotions override strategy
❌ Believing technical analysis is 100% accurate
Technical analysis improves probability — not certainty.
- The Bottom Line
Technical analysis is one of the most effective tools for understanding the market.
It helps traders become more confident, disciplined, and strategic — especially when combined with proper risk management and emotional control.
The key is to start with simple tools, practice reading charts, and gradually build your skills. With consistency, technical analysis becomes second nature.
Want more beginner-friendly trading lessons? Join the Für-Trade newsletter for weekly insights, tutorials, and market strategies designed to strengthen your trading journey.